A simple tool to compare compensation packages
Comparing apples to oranges
The higher up the corporate ladder you climb, the more complex and harder to understand those offers become. Stock options are the worst of it. Understanding them requires understanding the Black-Scholes formula. This level of applied math is beyond many. And even if you understand the math, predicting where the price of the underlying stock will go over the next 3, 4, or 5 years, is impossible. So, the math doesn’t help all that much. This is one reason why stock options are becoming less common and straight stock allocations (with time restrictions) more popular.
The other problem we often encounter is that the new package isn’t easily comparable to the one you currently have. Your current package may consist of a base salary and a performance bonus. The new offer may add deferred stock allocations.
Salary, cash bonuses, short-term RSUs, long-term RSUs - so confusing!
A friend of mine recently had to deal with this. She was particularly concerned about understanding her month-by-month, and year-by-year cashflows. Here's how I suggested she compare the two packages.
Most importantly, take all numbers at their present-day cash value. If you don't have any past track record to work with, don't try to guess. Stock may go up or down. There is no way of telling. With bonuses, it’s the same. The fairest way to make a comparison is to hold everything at present-day values.
At her old company, my friend received a base salary of $260,000 that hadn’t changed in three years. Additionally, she received performance bonuses each year that were based on personal performance, company performance, and other company considerations. This number varied over the three years. The highest was $90,000, and the lowest was $40,000. The average over the three years was $65,000. My friend thought this average value was a reasonable number to expect for the current fiscal year, as well.

Using a spreadsheet to understand cash flows
In comparison, the potential new employer was offering a more complex mix of salary, cash bonus for personal performance, a separate cash bonus for company performance, short-term restricted stock and long-term restricted stock. She could sell those short-term RSUs anytime once she received them. She would lose her annual allocation if she left the company before the end of any respective fiscal year. As for the long-term RSUs, she could only sell them after a holding period of three years. And she would lose some of them when resigning from the company.
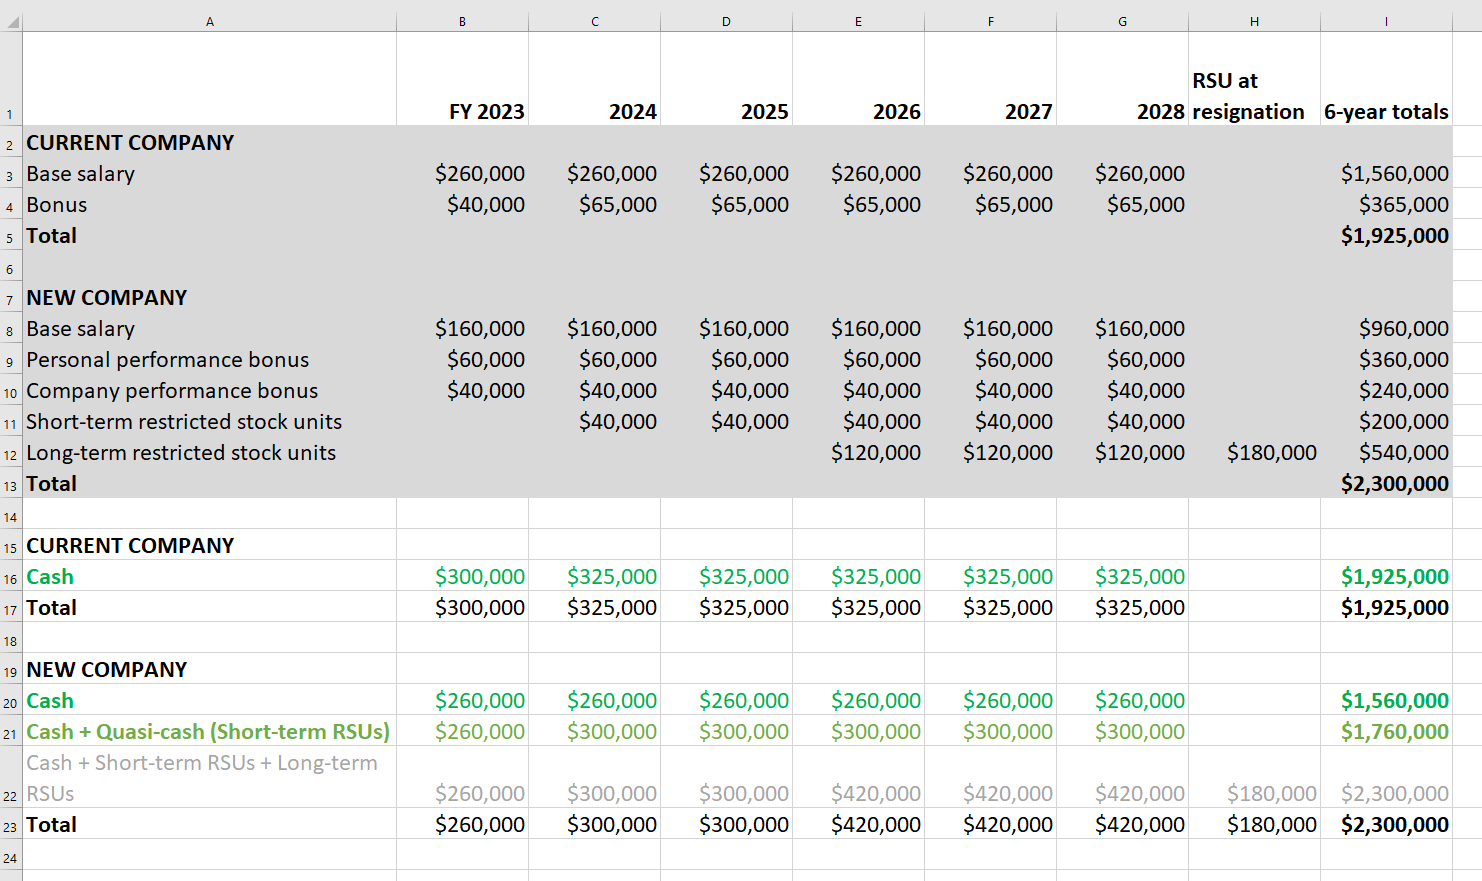
To have an easier time comparing her cash flows over the years I helped her create the spreadsheet in the image. We simulated cash for six years, assuming she’d resign from either of the respective employers after six years. (Six is the average of her tenures through her career so far.)
We held the base salary at the 2023 level because predicting its development at either company was impossible. The same went for bonuses and stock allocations, so we assumed the_ average of the past three years for the current employer and the 2023 offer figures for the new one.

Not rocket science
In the grey area, we filled in those numbers, item by item, for six years. In the white area below we reformulated, this time simplifying for cash vs non-cash payments. We treated the short-term stock allocations as quasi-cash.
As you can see, there was a clear trade-off between annual cash intake and potential upside from long-term stock allocations.
This sort of tool isn’t rocket science but it can help you make apples out of oranges. I hope it will be helpful to some of you!
This post is also available on my LinkedIn feed. Feel free to leave questions and comments there.
